PostgreSQL DB Monitoring
The PostgreSQL RDS Monitoring dashboard provides comprehensive real-time insights into your database performance, resource utilization, and overall health. This powerful monitoring solution helps you proactively identify potential issues, optimize performance, and ensure your database operates efficiently.
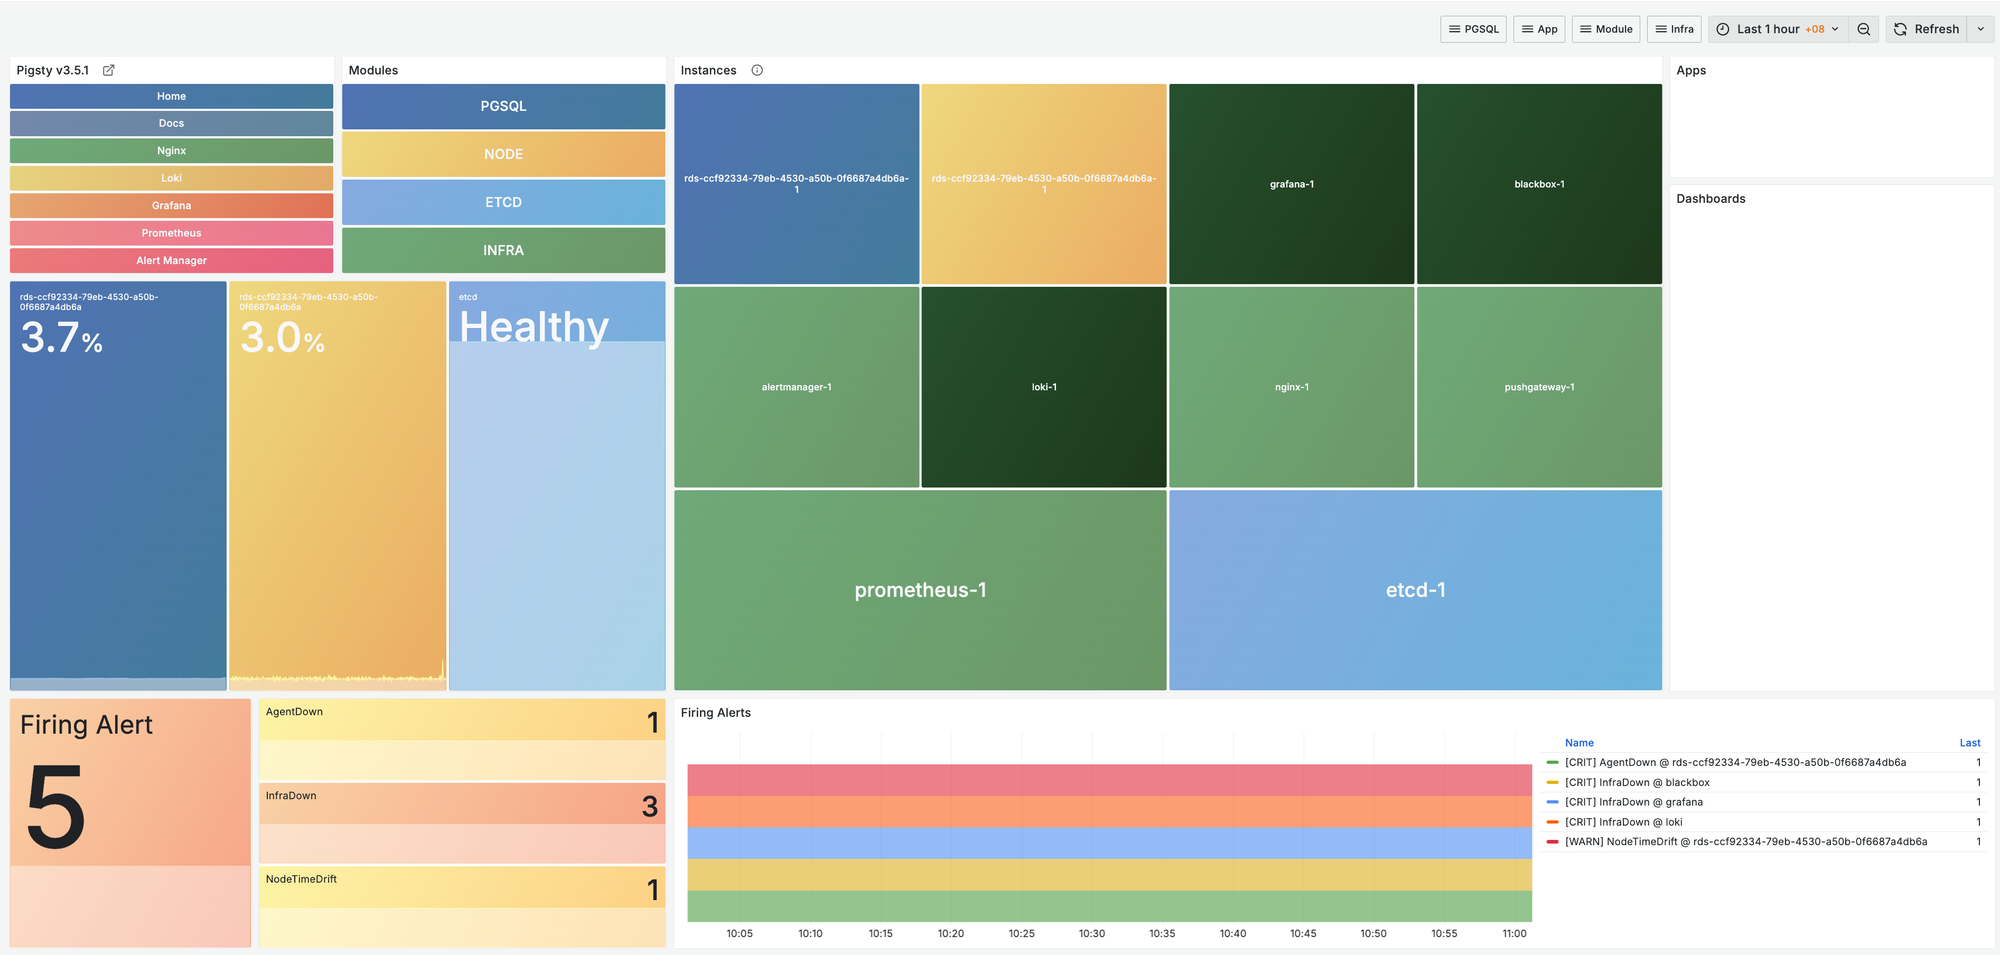
The monitoring dashboard home page gives you a consolidated view of all your PostgreSQL instances and their key metrics. From this central hub, you can:
- View the status of all your database instances at a glance
- Identify instances with performance anomalies
- Access detailed metrics for any specific instance
- Set up custom alerts and notifications
- View historical performance data
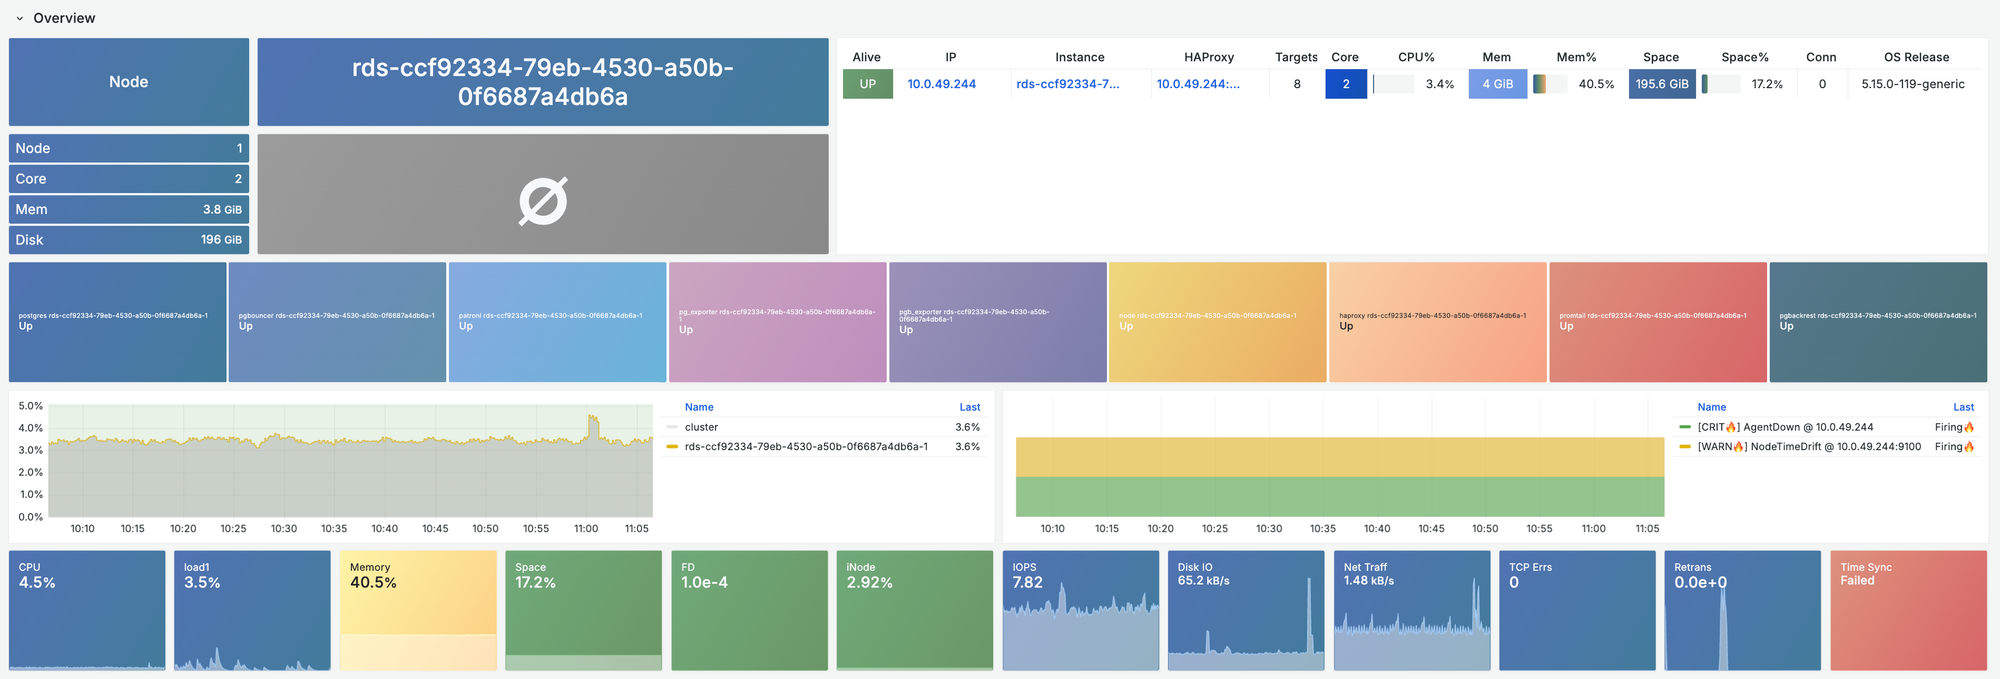
Database Overview
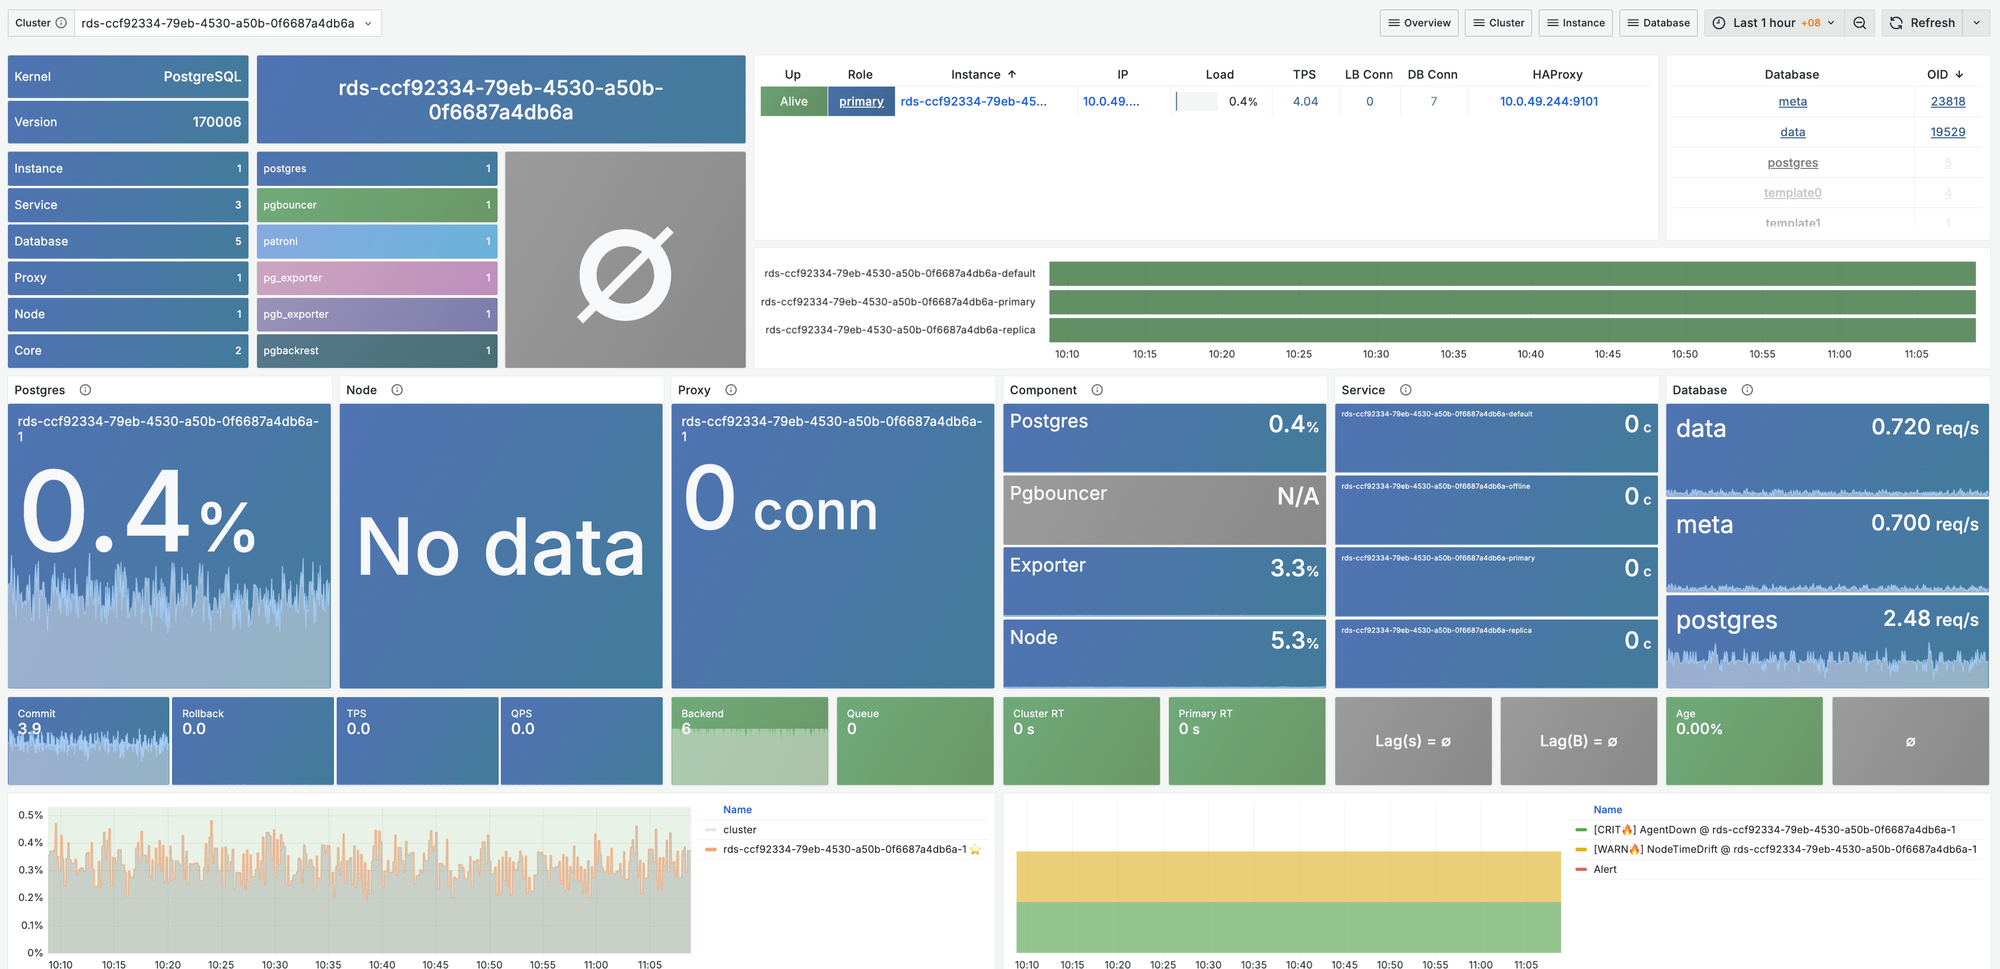
The database overview section provides essential information about your PostgreSQL instance:
- Connection Statistics: Current active connections, idle connections, and connection utilization percentage
- Transaction Rates: Transactions per second, commits, and rollbacks
- Query Performance: Average query execution time, slow queries, and query throughput
- Database Size: Total size, growth trends, and table-level size distribution
- Replication Status: Replication lag and status (for Primary/Standby deployments)
Instance Resource Monitoring
CPU Utilization
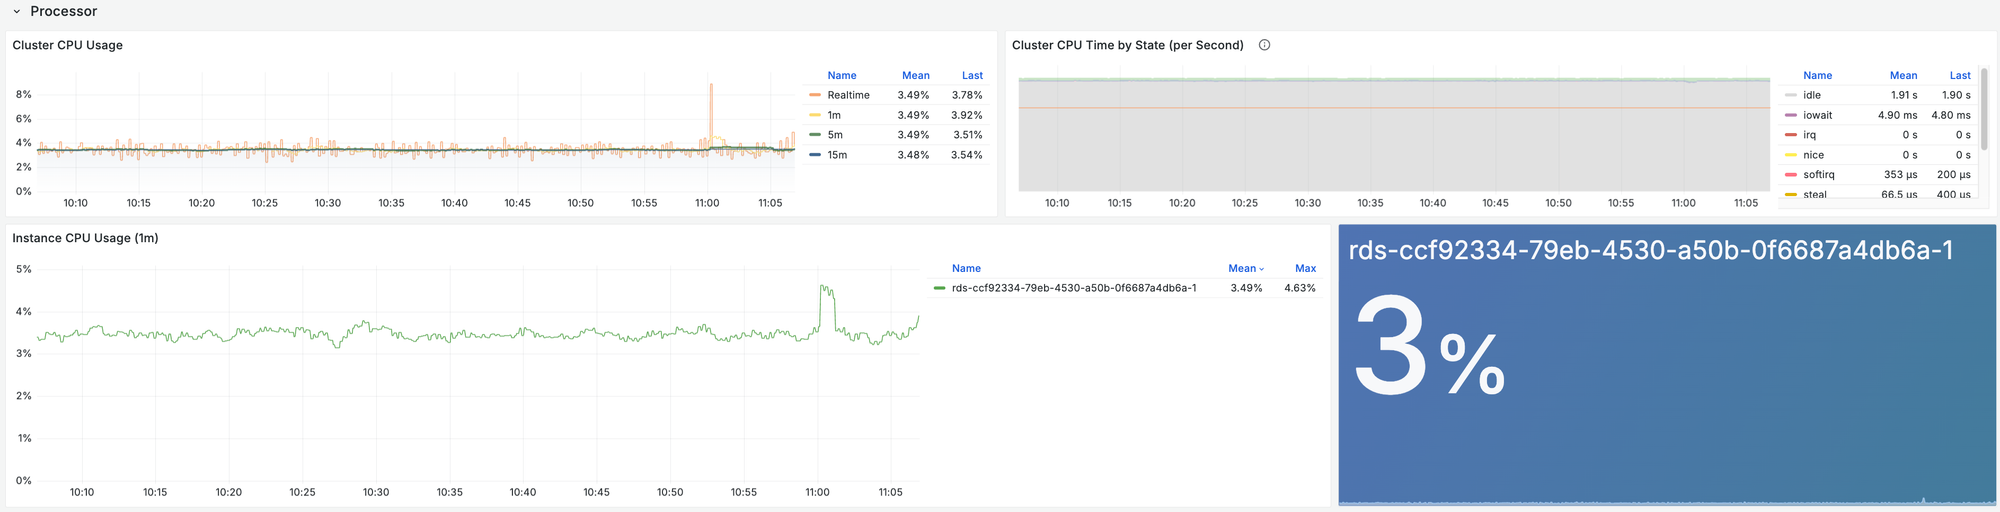
The CPU monitoring panel shows detailed metrics about processor utilization:
- CPU Usage: Overall CPU utilization percentage over time
- CPU Load: System load average for 1, 5, and 15-minute intervals
- Process Details: Top CPU-consuming database processes
- Core Distribution: CPU usage across available cores
Memory Usage
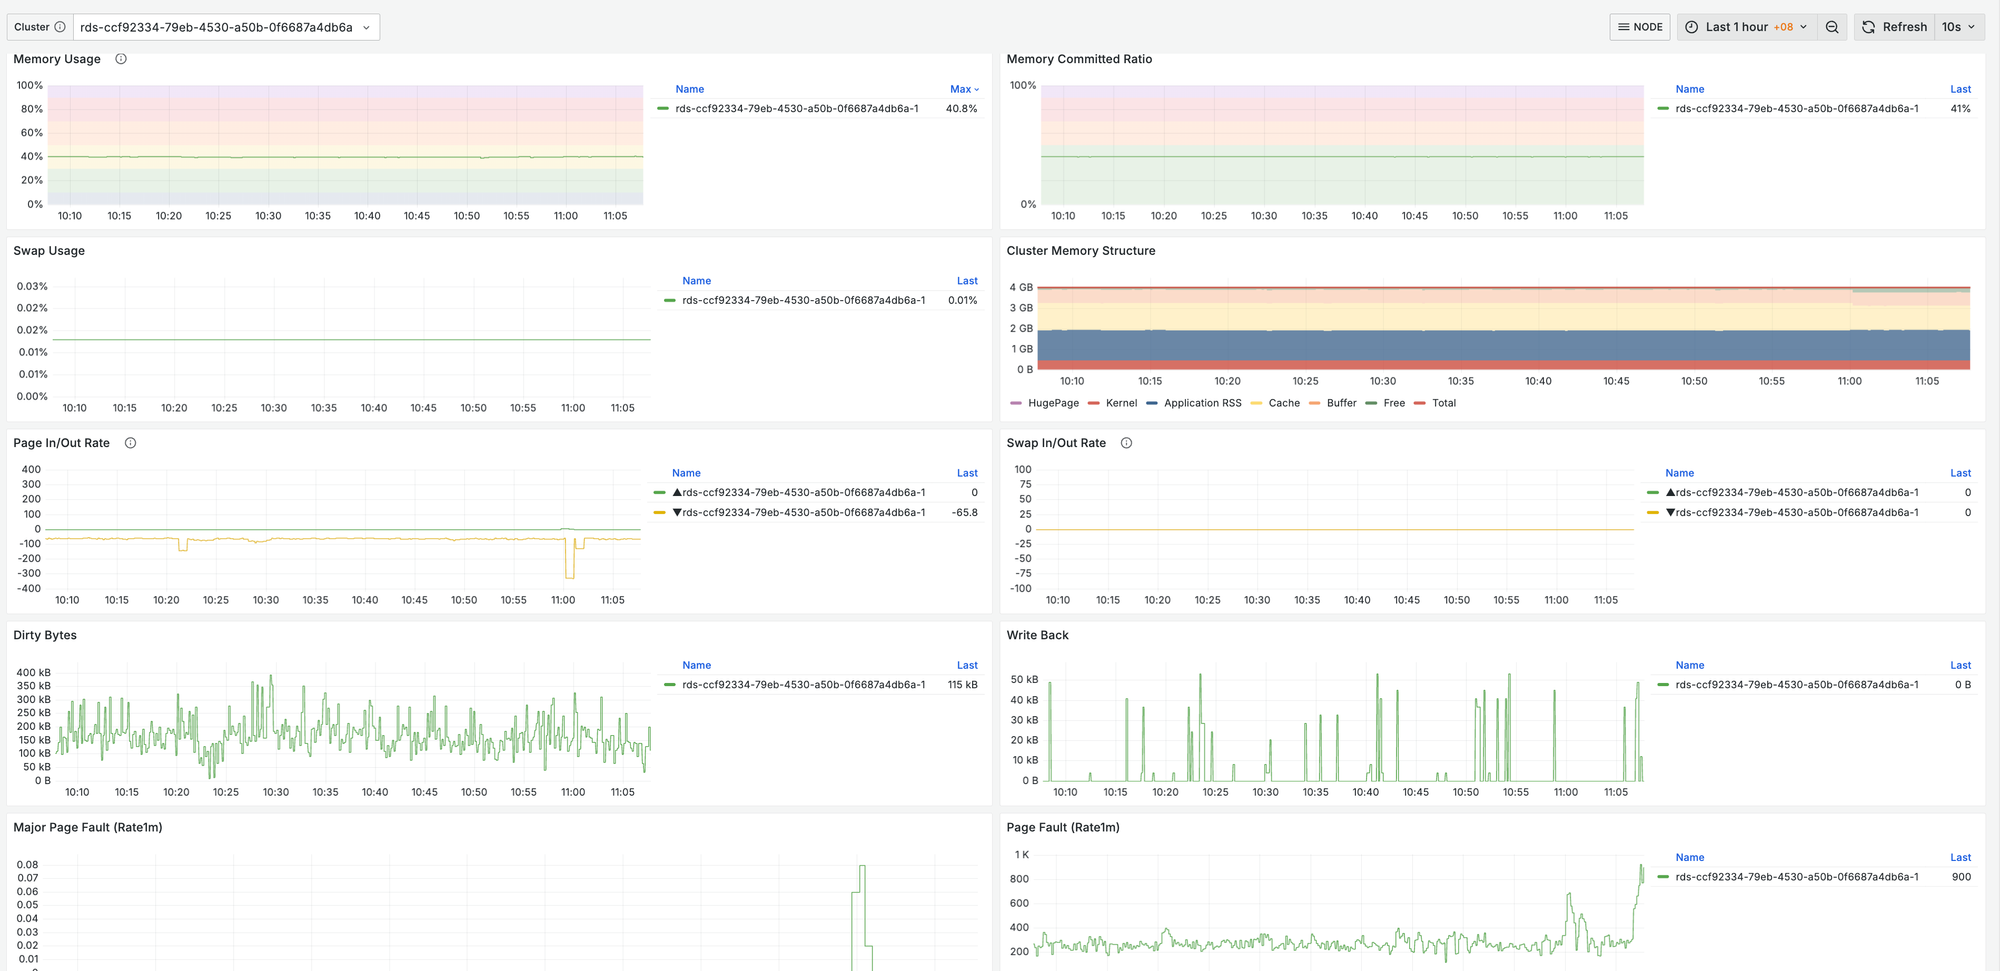
The memory monitoring section provides insights into RAM utilization:
- Total Memory Usage: Overall memory consumption percentage
- Buffer Cache: PostgreSQL buffer cache hit ratio and usage
- Shared Buffers: Allocation and utilization of shared memory buffers
- Work Memory: Usage patterns for query execution memory
Disk Performance
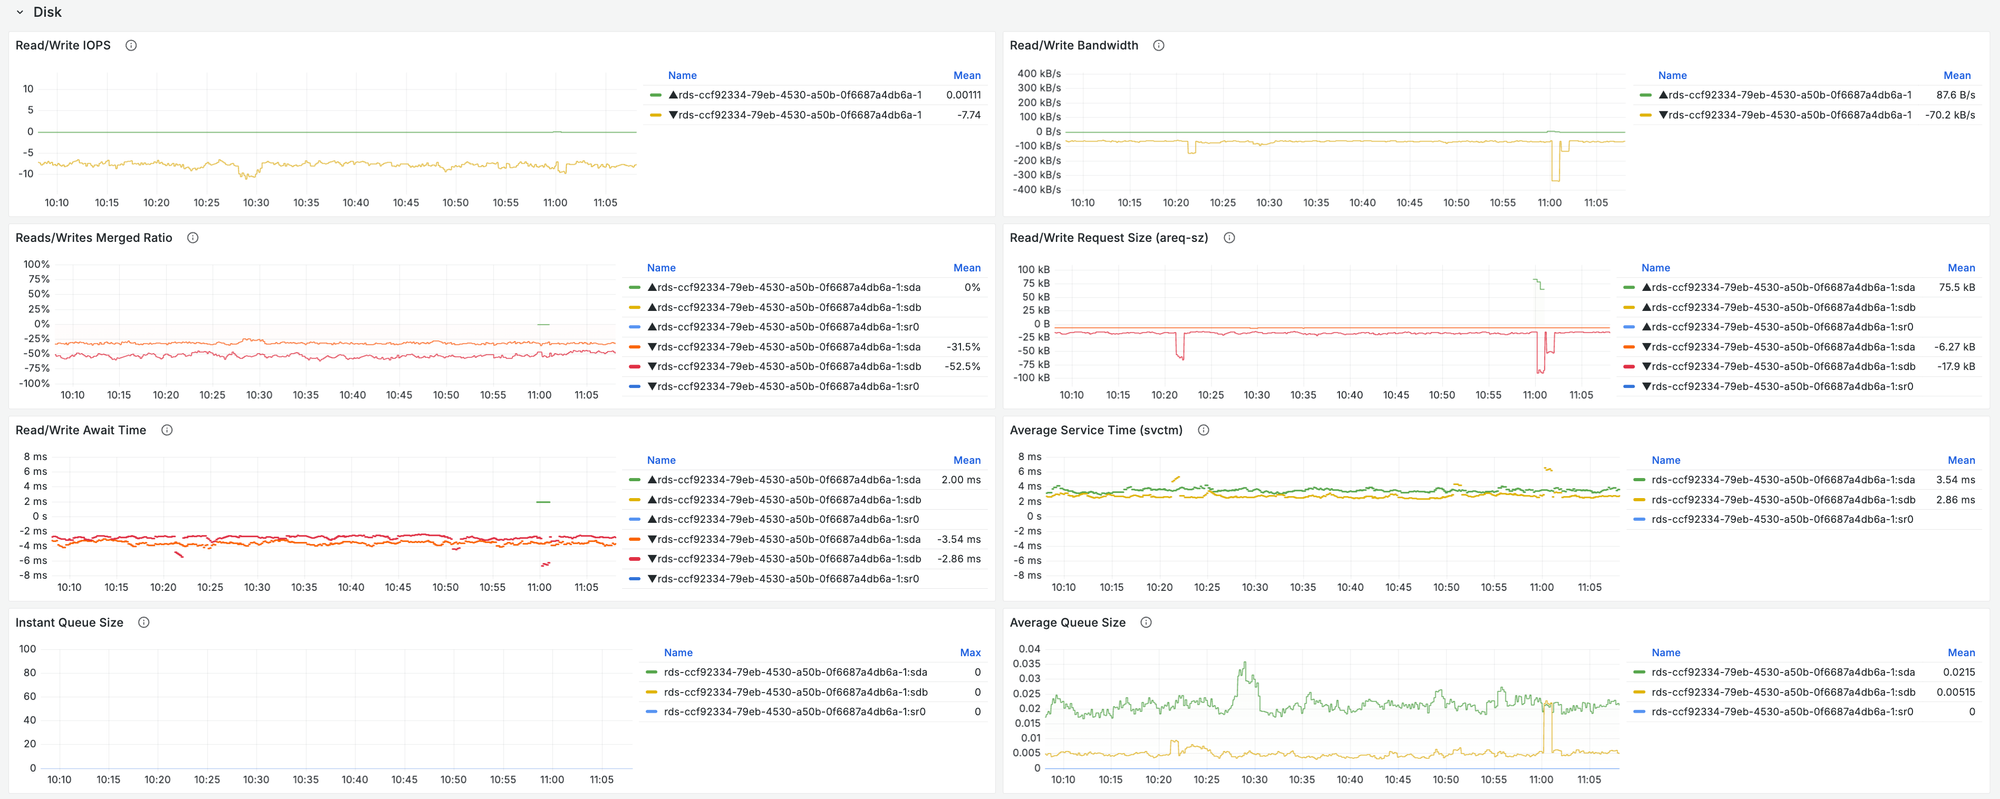
The disk monitoring panel shows storage performance metrics:
- IOPS: Input/output operations per second for reads and writes
- Throughput: Data transfer rates for disk operations
- Latency: Average response time for disk operations
- Space Usage: Storage consumption by database, tables, and indexes
- WAL (Write-Ahead Log): WAL generation rate and archiving status
Network Activity
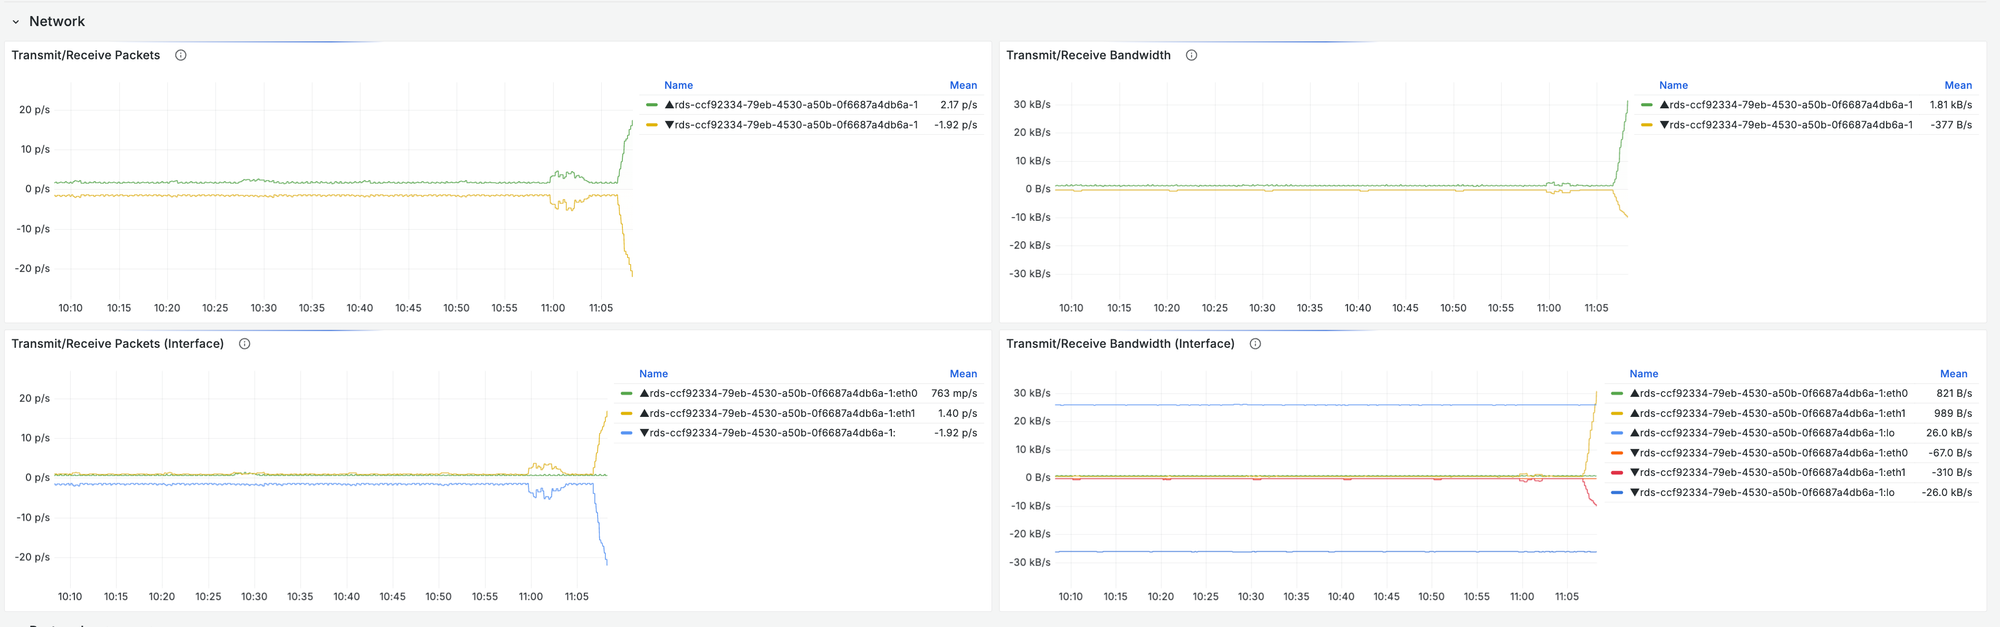
The network monitoring section displays connectivity and data transfer metrics:
- Network Traffic: Inbound and outbound data transfer rates
- Connection Count: Current and historical connection statistics
- Network Latency: Response time between clients and the database
- Packet Statistics: Packet counts, sizes, and error rates
Database Cluster Monitoring
For multi-node deployments (Primary/Standby or Cluster), this section provides cluster-specific metrics:
- Node Status: Health status of all nodes in the cluster
- Replication Lag: Time delay between primary and replica nodes
- Failover Events: History and details of any failover occurrences
- Cluster Synchronization: Data consistency status across the cluster
Setting Up Alerts
The monitoring system allows you to configure custom alerts based on performance thresholds:
- Metric-Based Alerts: Set thresholds for any monitored metric
- Anomaly Detection: Automatically identify unusual patterns in database behavior
- Notification Channels: Configure email, SMS, or integration with external alerting systems
- Alert History: Review past alerts and resolution status
Best Practices for Monitoring
- Regularly review performance dashboards to identify trends
- Set appropriate alert thresholds based on your workload patterns
- Use historical data to plan for capacity upgrades
- Correlate database metrics with application performance
- Establish baseline performance metrics for your specific workloads
There are many more detailed monitoring dashboards that cover all rounded aspects of the database.
There is everything that a DBA required to know in the monitoring.