RDS Operational Logs
The RDS Operational Logs feature provides a comprehensive audit trail of all administrative actions performed on your PostgreSQL database instances through the management console. This documentation explains how to access, interpret, and use these logs for security auditing, troubleshooting, and compliance purposes.
Overview
Operational logs capture all management actions performed on your RDS instances, including:
- Instance creation and deletion
- Configuration modifications
- Security group changes
- Backup and restore operations
- User management activities
- Parameter group changes
These logs are essential for:
- Security auditing and compliance reporting
- Troubleshooting configuration issues
- Tracking changes made by multiple administrators
- Verifying that requested changes were implemented correctly
Accessing Operational Logs
-
Navigate to the RDS Dashboard
- Log in to the cloud console
- Select "RDS" from the service menu
-
Access Logs Section
- Click on "Operational Logs" in the left navigation panel
- Alternatively, select a specific RDS instance and click the "Logs" tab
-
View Log Entries
- By default, logs from the last 24 hours are displayed
- Use filtering options to narrow down results
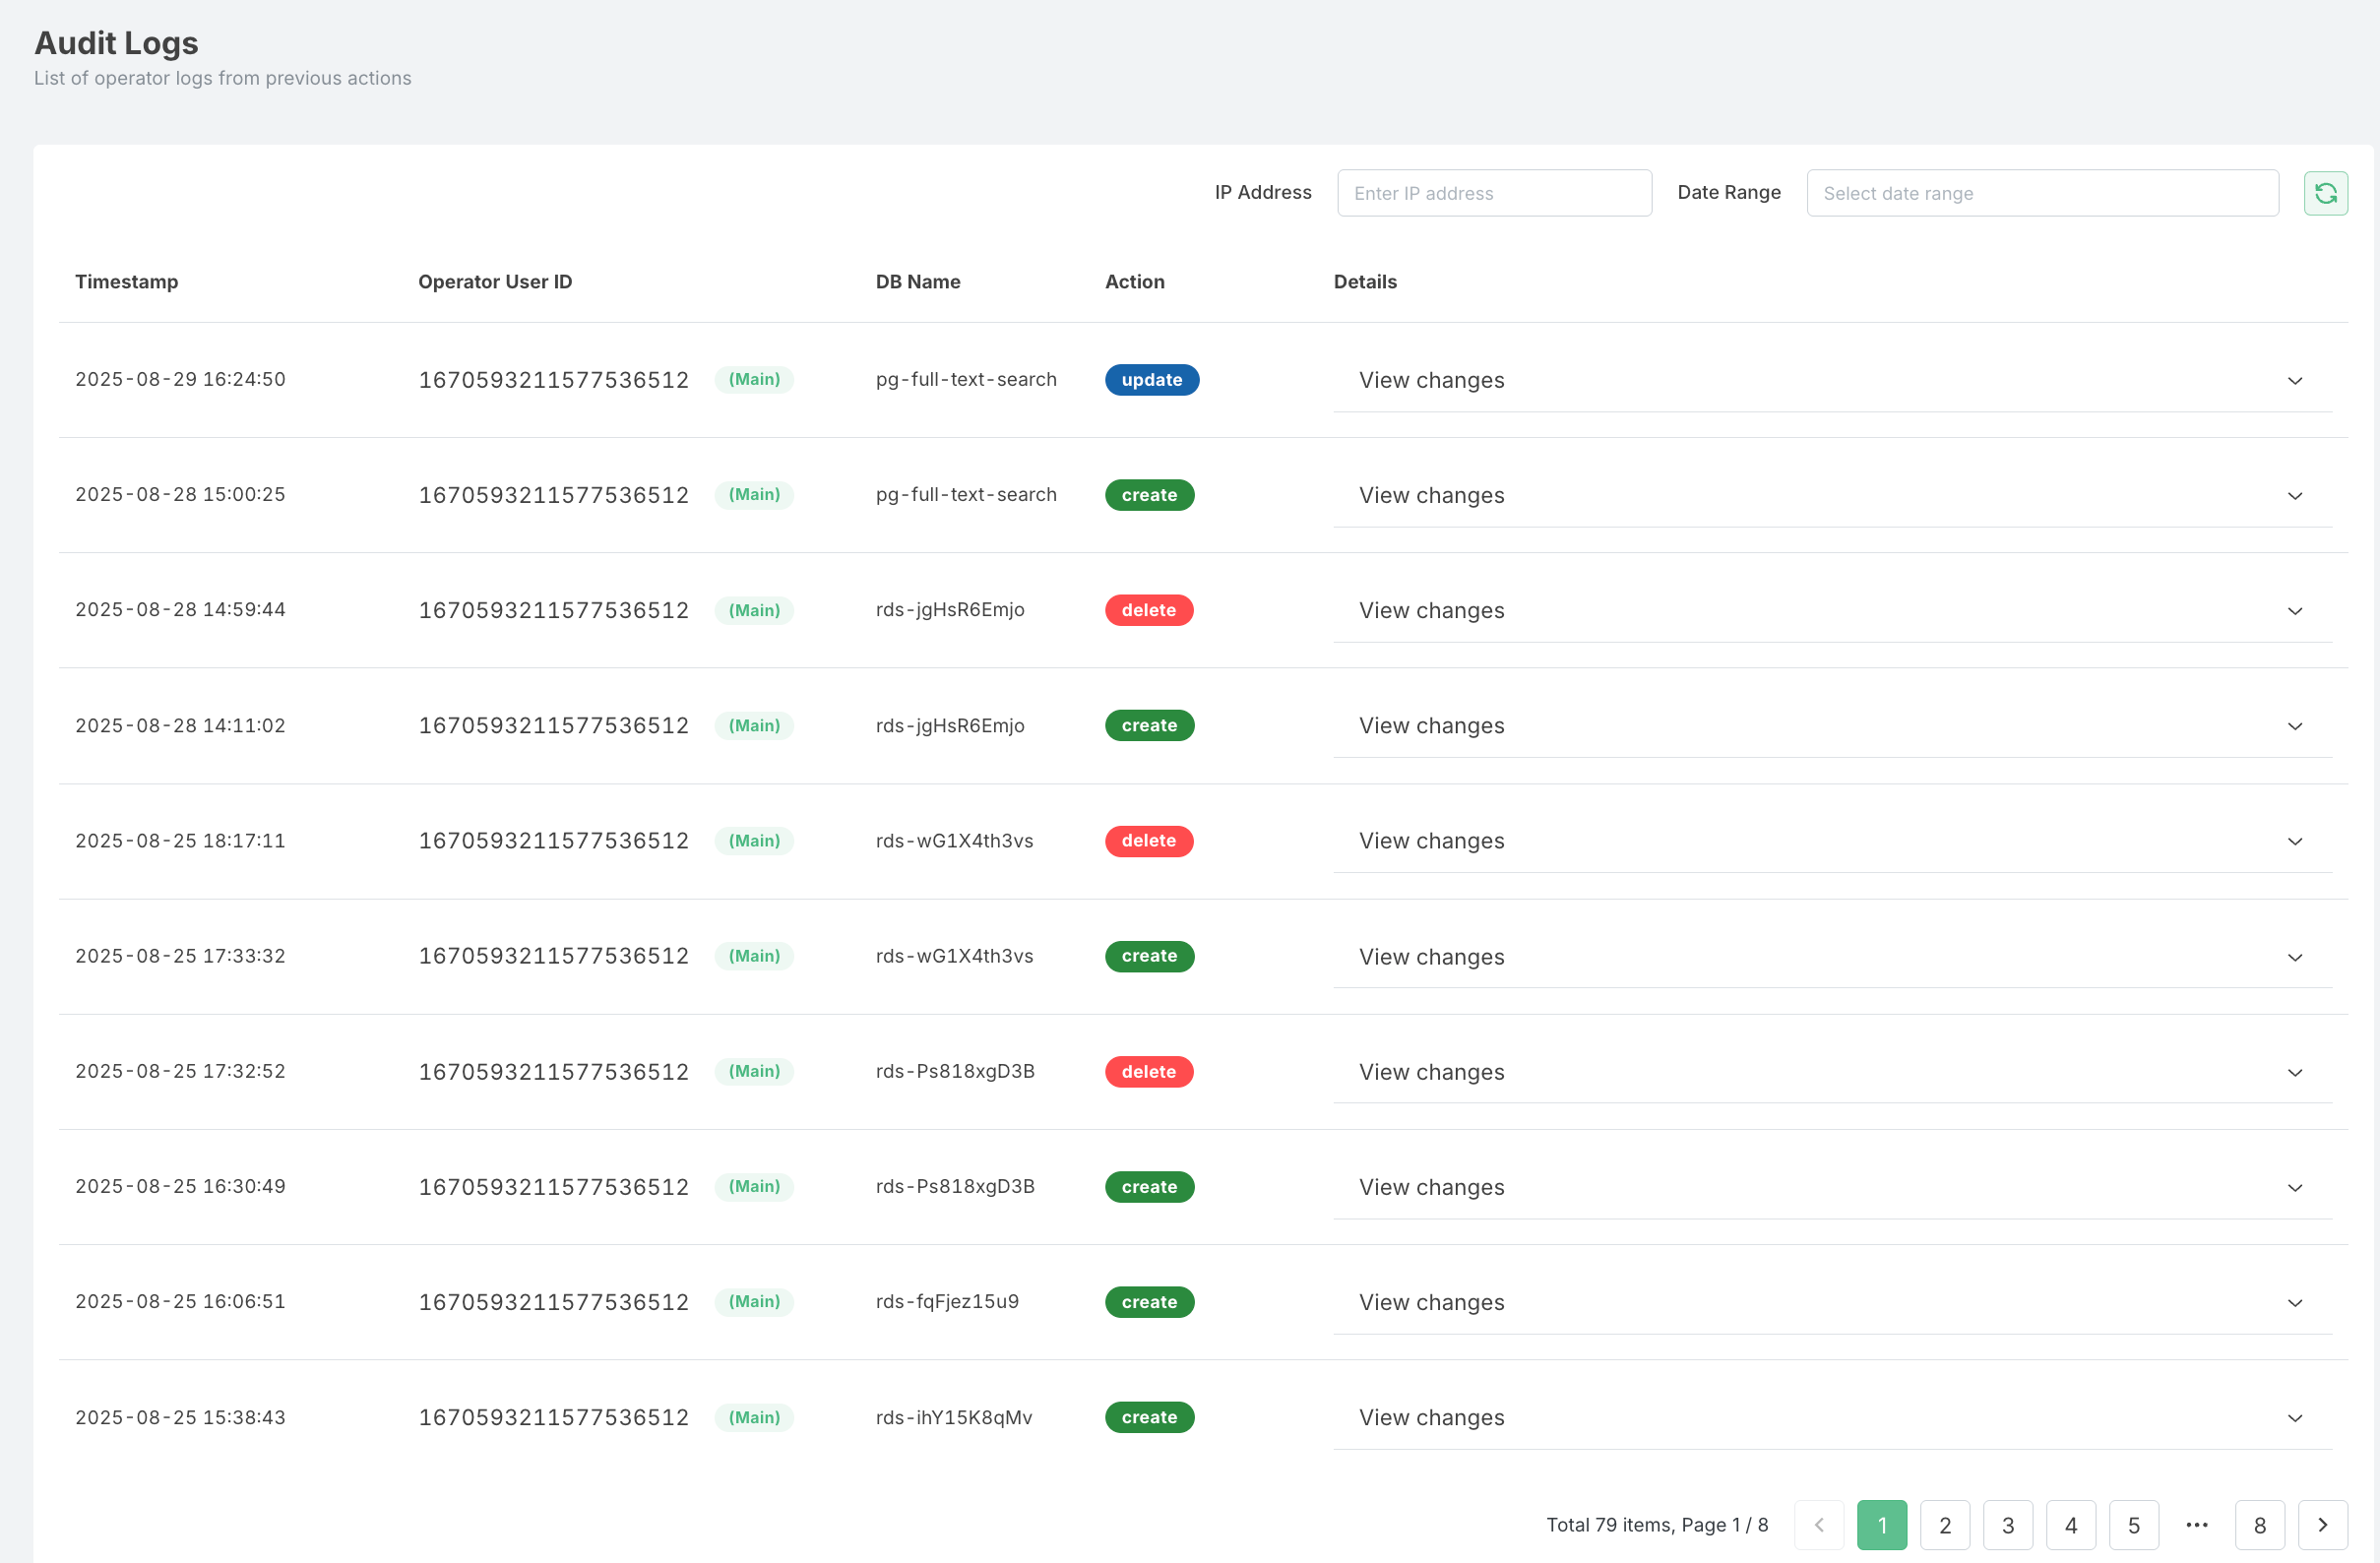
Log Entry Details
Each operational log entry contains the following information:
- Timestamp: Date and time when the action was performed
- Operation Type: The specific action that was taken (create, modify, delete, etc.)
- Resource ID: The identifier of the affected RDS instance
- User Identity: The user or service account that performed the action
- Source IP: The IP address from which the action was initiated
- Status: Whether the operation succeeded or failed
- Details: Additional information specific to the operation type
Filtering and Searching Logs
The Operational Logs interface provides several filtering options to help you find specific log entries:
- Time Range: Filter logs by specific time periods (last hour, day, week, or custom range)
- Operation Type: Filter by specific actions (create, modify, delete, restart, etc.)
- Resource ID: Filter logs for a specific RDS instance
- User Identity: Filter logs by the user who performed the actions
- Status: Filter by operation outcome (success, failure)
- Search: Use the search box to find logs containing specific text
- IP Address: Use the private IP address to find the RDS of your need
Common Operation Types
The following are common operation types you'll see in the logs:
- CreateDBInstance: Creation of a new RDS instance
- DeleteDBInstance: Deletion of an RDS instance
- ModifyDBInstance: Changes to instance configuration
- RebootDBInstance: Restart of an RDS instance
- CreateDBSnapshot: Manual backup creation
- RestoreDBInstanceFromSnapshot: Restore from a backup
- ModifyDBParameterGroup: Changes to database parameters
- ModifyDBSecurityGroups: Changes to security group settings
- CreateDBSecurityGroup: Creation of a new security group
- DeleteDBSecurityGroup: Deletion of a security group
Exporting Logs
For record-keeping, compliance, or further analysis, you can export operational logs:
- Apply Desired Filters: First, filter the logs to show only the entries you want to export
- Select Export Format: Choose from available export formats (CSV, JSON)
- Click Export: Use the export button to download the filtered logs
- Save File: Save the exported file to your local system
Log Retention
Operational logs are retained for a specific period according to your service plan:
- Standard Plan: 30 days of operational logs
- Premium Plan: 90 days of operational logs
- Enterprise Plan: 365 days of operational logs
For longer retention periods, consider regularly exporting logs to your own storage solution.
Security Considerations
- Operational logs contain sensitive information about your database configuration
- Access to these logs should be restricted to authorized personnel
- Regular review of operational logs is recommended as a security best practice
- Unexpected or unauthorized operations should be investigated promptly
Integration with Monitoring
While operational logs focus on administrative actions, they complement other monitoring tools:
- Database Logs: For SQL queries, errors, and database engine events
- Performance Metrics: For resource utilization and performance data
- Alert History: For notifications generated by monitoring thresholds
For SQL-specific logs and database engine logs, refer to the Monitoring Dashboard section of the documentation.